Analysis of Dataset
We analyzed the degree distribution and community structure of a network, focusing on community topology. Community topology refers to the way communities are structured within a network. To determine the existence of communities, we calculated the community density, which measures the density of edges within and between communities. If a community structure exists in the graph, we expect to observe a higher density within communities than between them. The density of edges is defined by whether they connect nodes within the same community (in-community edges) or nodes in different communities (out-community edges). The in-community density is calculated based on the density of in-community edges. This approach enables us to gain insights into the community structure of a network and the patterns of connectivity between nodes. The in-community density is defined as:
\[\text{density} = \frac{\text{number of edges in-community}}{\text{number of edges out-community}}\]
Analysis of CORA
NOTE: Terminologies used in the analysis:
- Internal Density: Proportion of edges that exist within a community.
- Positive Density Gap: Difference between the density of edges within a community and the average density of edges outside that community. A positive density gap indicates that the community is more densely connected internally than with nodes outside the community.
- Average Density: Proportion of edges that exist within a network as a whole.
- Negative Density Gap: Difference between the density of edges within a community and the average density of edges outside that community. A negative density gap indicates that the community is less densely connected internally than with nodes outside the community.
Note: Detailed Community Analysis data can be viewed in the data analysis notebooks in the Git repository.
Degree distribution
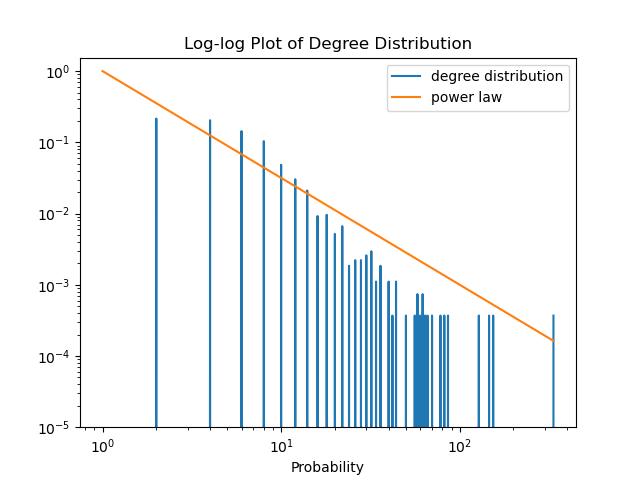
The degree distribution of the CORA citation network dataset exhibits characteristics of a power-law distribution, common to many real-world networks. A power-law distribution is a statistical pattern where the frequency of occurrence of events decreases rapidly as the magnitude of the event increases. This distribution suggests the presence of hub nodes, which have significantly more connections than most nodes in the network. The majority of nodes in the dataset have a low degree, while a small number of nodes act as hubs, possessing a high degree of connections. Hub nodes are nodes with a high degree of connections. Hub nodes are critical in network analysis as they play a significant role in the network’s overall connectivity and function.
In the CORA dataset, all communities exhibit a higher internal density, as represented by the positive density gap. The average density of these communities is relatively large, with a density gap of 0.6199. This suggests a clear community structure within the dataset in terms of community topology.
Analysis of Twitch Gamer
Degree distribution
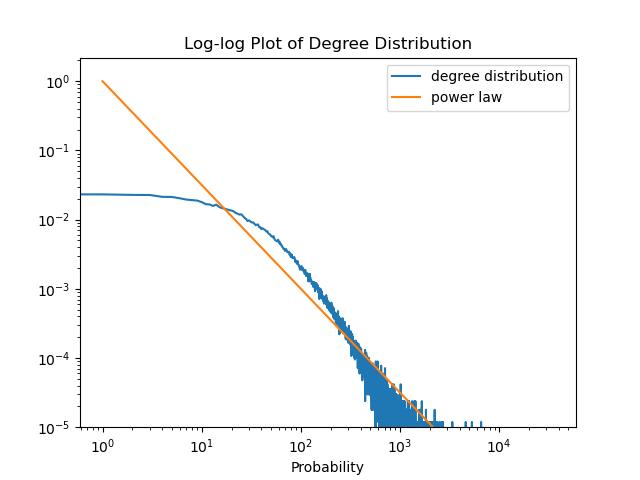
As we can see, the plot of degree distribution for the Twitch dataset and indicates that its degree distribution follows characteristics similar to the previously mentioned CORA dataset. Specifically, the distribution of degrees in the Twitch dataset appears to follow a power-law distribution as well. As a result, the majority of nodes in the Twitch dataset have a low degree, while a small number of nodes act as hubs with a high degree of connections. T The similarity in degree distribution between the CORA and Twitch datasets suggests that both datasets have comparable network structures, where a small number of hub nodes play a significant role in the overall connectivity and function of the network.
For the Twitch language communities, some communities have a negative density gap, indicating lower in-community density than out-community density. However, these communities are typically small in size. The average density of the Twitch language communities is characterized by a significant density gap of 0.799. While the English (EN) community shows a clear community structure, other communities are less significant and difficult to detect in terms of community topology. Therefore, this dataset exhibits a weak community structure in terms of community topology.